As security professionals, we're constantly looking for ways to reduce risk and improve our workflow's efficiency. We've made great strides in using AI to identify malicious content, block threats, and discover and fix vulnerabilities. We also published the Secure AI Framework (SAIF), a conceptual framework for secure AI systems to ensure we are deploying AI in a responsible manner.
Today we are highlighting another way we use generative AI to help the defenders gain the advantage: Leveraging LLMs (Large Language Model) to speed-up our security and privacy incidents workflows.
Incident management is a team sport. We have to summarize security and privacy incidents for different audiences including executives, leads, and partner teams. This can be a tedious and time-consuming process that heavily depends on the target group and the complexity of the incident. We estimate that writing a thorough summary can take nearly an hour and more complex communications can take multiple hours. But we hypothesized that we could use generative AI to digest information much faster, freeing up our incident responders to focus on other more critical tasks - and it proved true. Using generative AI we could write summaries 51% faster while also improving the quality of them.
When suspecting a potential data incident, for example,we follow a rigorous process to manage it. From the identification of the problem, the coordination of experts and tools, to its resolution and then closure. At Google, when an incident is reported, our Detection & Response teams work to restore normal service as quickly as possible, while meeting both regulatory and contractual compliance requirements. They do this by following the five main steps in the Google incident response program:
Identification: Monitoring security events to detect and report on potential data incidents using advanced detection tools, signals, and alert mechanisms to provide early indication of potential incidents.
Coordination: Triaging the reports by gathering facts and assessing the severity of the incident based on factors such as potential harm to customers, nature of the incident, type of data that might be affected, and the impact of the incident on customers. A communication plan with appropriate leads is then determined.
Resolution: Gathering key facts about the incident such as root cause and impact, and integrating additional resources as needed to implement necessary fixes as part of remediation.
Closure: After the remediation efforts conclude, and after a data incident is resolved, reviewing the incident and response to identify key areas for improvement.
Continuous improvement: Is crucial for the development and maintenance of incident response programs. Teams work to improve the program based on lessons learned, ensuring that necessary teams, training, processes, resources, and tools are maintained.
Google’s Incident Response Process diagram flow
Our detection and response processes are critical in protecting our billions of global users from the growing threat landscape, which is why we’re continuously looking for ways to improve them with the latest technologies and techniques. The growth of generative AI has brought with it incredible potential in this area, and we were eager to explore how it could help us improve parts of the incident response process. We started by leveraging LLMs to not only pioneer modern approaches to incident response, but also to ensure that our processes are efficient and effective at scale.
Managing incidents can be a complex process and an additional factor is effective internal communication to leads, executives and stakeholders on the threats and status of incidents. Effective communication is critical as it properly informs executives so that they can take any necessary actions, as well as to meet regulatory requirements. Leveraging LLMs for this type of communication can save significant time for the incident commanders while improving quality at the same time.
Given that LLMs have summarization capabilities, we wanted to explore if they are able to generate summaries on par, or as well as humans can. We ran an experiment that took 50 human-written summaries from native and non-native English speakers, and 50 LLM-written ones with our finest (and final) prompt, and presented them to security teams without revealing the author.
We learned that the LLM-written summaries covered all of the key points, they were rated 10% higher than their human-written equivalents, and cut the time necessary to draft a summary in half.
Comparison of human vs LLM content completeness
Comparison of human vs LLM writing styles
Leveraging generative AI is not without risks. In order to mitigate the risks around potential hallucinations and errors, any LLM generated draft must be reviewed by a human. But not all risks are from the LLM - human misinterpretation of a fact or statement generated by the LLM can also happen. That is why it’s important to ensure there is human accountability, as well as to monitor quality and feedback over time.
Given that our incidents can contain a mixture of confidential, sensitive, and privileged data, we had to ensure we built an infrastructure that does not store any data. Every component of this pipeline - from the user interface to the LLM to output processing - has logging turned off. And, the LLM itself does not use any input or output for re-training. Instead, we use metrics and indicators to ensure it is working properly.
The type of data we process during incidents can be messy and often unstructured: Free-form text, logs, images, links, impact stats, timelines, and code snippets. We needed to structure all of that data so the LLM “knew” which part of the information serves what purpose. For that, we first replaced long and noisy sections of codes/logs by self-closing tags (<Code Section/> and <Logs/>) both to keep the structure while saving tokens for more important facts and to reduce risk of hallucinations.
During prompt engineering, we refined this approach and added additional tags such as <Title>, <Actions Taken>, <Impact>, <Mitigation History>, <Comment> so the input’s structure becomes closely mirrored to our incident communication templates. The use of self-explanatory tags allowed us to convey implicit information to the model and provide us with aliases in the prompt for the guidelines or tasks, for example by stating “Summarize the <Security Incident>”.
Sample {incident} input
Once we added structure to the input, it was time to engineer the prompt. We started simple by exploring how LLMs can view and summarize all of the current incident facts with a short task:
Caption: First prompt version
Limits of this prompt:
The summary was too long, especially for executives trying to understand the risk and impact of the incident
Some important facts were not covered, such as the incident’s impact and its mitigation
The writing was inconsistent and not following our best practices such as “passive voice”, “tense”, “terminology” or “format”
Some irrelevant incident data was being integrated into the summary from email threads
The model struggled to understand what the most relevant and up-to-date information was
For version 2, we tried a more elaborate prompt that would address the problems above: We told the model to be concise and we explained what a well-written summary should be: About the main incident response steps (coordination and resolution).
Second prompt version
The summaries still did not always succinctly and accurately address the incident in the format we were expecting
At times, the model lost sight of the task or did not take all the guidelines into account
The model still struggled to stick to the latest updates
We noticed a tendency to draw conclusions on hypotheses with some minor hallucinations
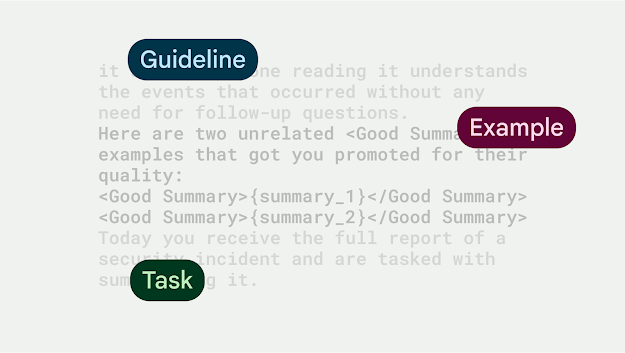
For the final prompt, we inserted 2 human-crafted summary examples and introduced a <Good Summary> tag to highlight high quality summaries but also to tell the model to immediately start with the summary without first repeating the task at hand (as LLMs usually do).
Final prompt
This produced outstanding summaries, in the structure we wanted, with all key points covered, and almost without any hallucinations.
In integrating the prompt into our workflow, we wanted to ensure it was complementing the work of our teams, vs. solely writing communications. We designed the tooling in a way that the UI had a ‘Generate Summary’ button, which would pre-populate a text field with the summary that the LLM proposed. A human user can then either accept the summary and have it added to the incident, do manual changes to the summary and accept it, or discard the draft and start again.
UI showing the ‘generate draft’ button and LLM proposed summary around a fake incident
Our newly-built tool produced well-written and accurate summaries, resulting in 51% time saved, per incident summary drafted by an LLM, versus a human.
Time savings using LLM-generated summaries (sample size: 300)
The only edge cases we have seen were around hallucinations when the input size was small in relation to the prompt size. In these cases, the LLM made up most of the summary and key points were incorrect. We fixed this programmatically: If the input size is smaller than 200 tokens, we won’t call the LLM for a summary and let the humans write it.
Given these results, we explored other ways to apply and build upon the summarization success and apply it to more complex communications. We improved upon the initial summary prompt and ran an experiment to draft executive communications on behalf of the Incident Commander (IC). The goal of this experiment was to ensure executives and stakeholders quickly understand the incident facts, as well as allow ICs to relay important information around incidents. These communications are complex because they go beyond just a summary - they include different sections (such as summary, root cause, impact, and mitigation), follow a specific structure and format, as well as adhere to writing best practices (such as neutral tone, active voice instead of passive voice, minimize acronyms).
This experiment showed that generative AI can evolve beyond high level summarization and help draft complex communications. Moreover, LLM-generated drafts, reduced time ICs spent writing executive summaries by 53% of time, while delivering at least on-par content quality in terms of factual accuracy and adherence to writing best practices.
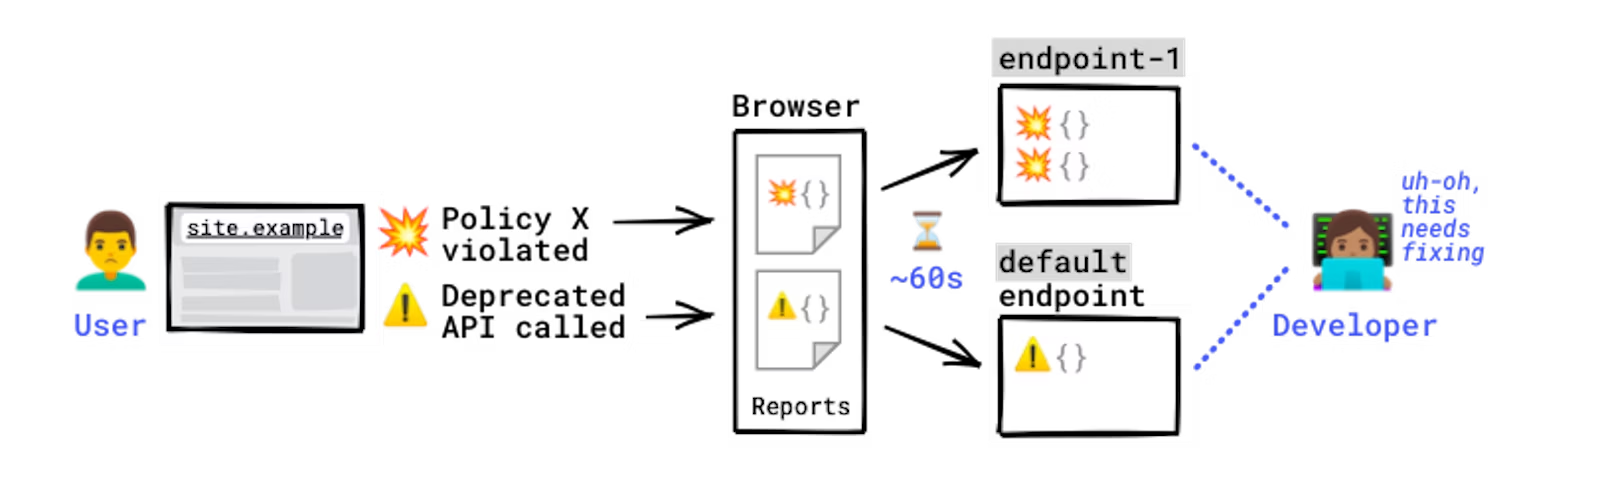
The Reporting API is an emerging web standard that provides a generic reporting mechanism for issues occurring on the browsers visiting your production website. The reports you receive detail issues such as security violations or soon-to-be-deprecated APIs, from users’ browsers from all over the world.
Collecting reports is often as simple as specifying an endpoint URL in the HTTP header; the browser will automatically start forwarding reports covering the issues you are interested in to those endpoints. However, processing and analyzing these reports is not that simple. For example, you may receive a massive number of reports on your endpoint, and it is possible that not all of them will be helpful in identifying the underlying problem. In such circumstances, distilling and fixing issues can be quite a challenge.
In this blog post, we'll share how the Google security team uses the Reporting API to detect potential issues and identify the actual problems causing them. We'll also introduce an open source solution, so you can easily replicate Google's approach to processing reports and acting on them.
Some errors only occur in production, on users’ browsers to which you have no access. You won't see these errors locally or during development because there could be unexpected conditions real users, real networks, and real devices are in. With the Reporting API, you directly leverage the browser to monitor these errors: the browser catches these errors for you, generates an error report, and sends this report to an endpoint you've specified.
How reports are generated and sent.
Errors you can monitor with the Reporting API include:
For a full list of error types you can monitor, see use cases and report types.
The Reporting API is activated and configured using HTTP response headers: you need to declare the endpoint(s) you want the browser to send reports to, and which error types you want to monitor. The browser then sends reports to your endpoint in POST requests whose payload is a list of reports.
Example setup:
# Example setup to receive CSP violations reports, Document-Policy violations reports, and Deprecation reports
Reporting-Endpoints: main-endpoint="https://reports.example/main", default="https://reports.example/default"
# CSP violations and Document-Policy violations will be sent to `main-endpoint`
Content-Security-Policy: script-src 'self'; object-src 'none'; report-to main-endpoint;
Document-Policy: document-write=?0; report-to=main-endpoint;
# Deprecation reports are generated automatically and don't need an explicit endpoint; they're always sent to the `default` endpoint
Note: Some policies support "report-only" mode. This means the policy sends a report, but doesn't actually enforce the restriction. This can help you gauge if the policy is working effectively.
Chrome users whose browsers generate reports can see them in DevTools in the Application panel:
Example of viewing reports in the Application panel of DevTools.
You can generate various violations and see how they are received on a server in the reporting endpoint demo:
Example violation reports
The Reporting API is supported by Chrome, and partially by Safari as of March 2024. For details, see the browser support table.
Google benefits from being able to uplift security at scale. Web platform mitigations like Content Security Policy, Trusted Types, Fetch Metadata, and the Cross-Origin Opener Policy help us engineer away entire classes of vulnerabilities across hundreds of Google products and thousands of individual services, as described in this blogpost.
One of the engineering challenges of deploying security policies at scale is identifying code locations that are incompatible with new restrictions and that would break if those restrictions were enforced. There is a common 4-step process to solve this problem:
With the Reporting API, we have the ability to run this cycle using a unified reporting endpoint and a single schema for several security features. This allows us to gather reports for a variety of features across different browsers, code paths, and types of users in a centralized way.
Note: A violation report is generated when an entity is attempting an action that one of your policies forbids. For example, you've set CSP on one of your pages, but the page is trying to load a script that's not allowed by your CSP. Most reports generated via the Reporting API are violation reports, but not all — other types include deprecation reports and crash reports. For details, see Use cases and report types.
Unfortunately, it is common for noise to creep into streams of violation reports, which can make finding incompatible code locations difficult. For example, many browser extensions, malware, antivirus software, and devtools users inject third-party code into the DOM or use forbidden APIs. If the injected code is incompatible with the policy, this can lead to violation reports that cannot be linked to our code base and are therefore not actionable. This makes triaging reports difficult and makes it hard to be confident that all code locations have been addressed before enforcing new policies.
Over the years, Google has developed a number of techniques to collect, digest, and summarize violation reports into root causes. Here is a summary of the most useful techniques we believe developers can use to filter out noise in reported violations:
It is often the case that a piece of code that is incompatible with the policy executes several times throughout the lifetime of a browser tab. Each time this happens, a new violation report is created and queued to be sent to the reporting endpoint. This can quickly lead to a large volume of individual reports, many of which contain redundant information. Because of this, grouping violation reports into clusters enables developers to abstract away individual violations and think in terms of root causes. Root causes are simpler to understand and can speed up the process of identifying useful refactorings.
Let's take a look at an example to understand how violations may be grouped. For instance, a report-only CSP that forbids the use of inline JavaScript event handlers is deployed. Violation reports are created on every instance of those handlers and have the following fields set:
blockedURL
inline
scriptSample
documentURL
Most of the time, these three fields uniquely identify the inline handlers in a given URL, even if the values of other fields differ. This is common when there are tokens, timestamps, or other random values across page loads. Depending on your application or framework, the values of these fields can differ in subtle ways, so being able to do fuzzy matches on reporting values can go a long way in grouping violations into actionable clusters. In some cases, we can group violations whose URL fields have known prefixes, for example all violations with URLs that start with chrome-extension, moz-extension, or safari-extension can be grouped together to set root causes in browser extensions aside from those in our codebase with a high degree of confidence.
chrome-extension
moz-extension
safari-extension
Developing your own grouping strategies helps you stay focused on root causes and can significantly reduce the number of violation reports you need to triage. In general, it should always be possible to select fields that uniquely identify interesting types of violations and use those fields to prioritize the most important root causes.
Another way of distinguishing non-actionable from actionable violation reports is ambient information. This is data that is contained in requests to our reporting endpoint, but that is not included in the violation reports themselves. Ambient information can hint at sources of noise in a client's set up that can help with triage:
Some types of violations have a source_file field or equivalent. This field represents the JavaScript file that triggered the violation and is usually accompanied by a line and column number. These three bits of data are a high-quality signal that can point directly to lines of code that need to be refactored.
source_file
Nevertheless, it is often the case that source files fetched by browsers are compiled or minimized and don't map directly to your code base. In this case, we recommend you use JavaScript source maps to map line and column numbers between deployed and authored files. This allows you to translate directly from violation reports to lines of source code, yielding highly actionable report groups and root causes.
The Reporting API sends browser-side events, such as security violations, deprecated API calls, and browser interventions, to the specified endpoint on a per-event basis. However, as explained in the previous section, to distill the real issues out of those reports, you need a data processing system on your end.
Fortunately, there are plenty of options in the industry to set up the required architecture, including open source products. The fundamental pieces of the required system are the following:
Solutions for each of the components listed above are made available by public cloud platforms, SaaS services, and as open source software. See the Alternative solutions section for details, and the following section outlining a sample application.
To help you understand how to receive reports from browsers and how to handle these received reports, we created a small sample application that demonstrates the following processes that are required for distilling web application security issues from reports sent by browsers:
Although this sample is relying on Google Cloud, you can replace each of the components with your preferred technologies. An overview of the sample application is illustrated in the following diagram:
Components described as green boxes are components that you need to implement by yourself. Forwarder is a simple web server that receives reports in the JSON format and converts them to the schema for Bigtable. Beam-collector is a simple Apache Beam pipeline that filters noisy reports, aggregates relevant reports into the shape of constellations, and saves them as CSV files. These two components are the key parts to make better use of reports from the Reporting API.
Because this is a runnable sample application, you are able to deploy all components to a Google Cloud project and see how it works by yourself. The detailed prerequisites and the instructions to set up the sample system are documented in the README.md file.
Aside from the open source solution we shared, there are a number of tools available to assist in your usage of the Reporting API. Some of them include:
Besides pricing, consider the following points when selecting alternatives:
In this article, we explained how web developers can collect client-side issues by using the Reporting API, and the challenges of distilling the real problems out of the collected reports. We also introduced how Google solves those challenges by filtering and processing reports, and shared an open source project that you can use to replicate a similar solution. We hope this information will motivate more developers to take advantage of the Reporting API and, in consequence, make their website more secure and sustainable.


.png)